
Blog
Using Power BI for reporting and analysis - Meritshot
Using Power BI for reporting and analysis
February 18, 2024
Master Power BI reporting and analysis. Create interactive dashboards and visualize data for smarter business decision-making.
.avif)

Power BI for business intelligence: Using Power BI for R

Introduction:
Business Intelligence (BI) tools act like smart helpers for companies. Imagine having a friendly guide that takes all the messy information around and turns it into useful insights. These tools help bosses and decision-makers by giving them real-time info in a way that’s easy to understand. Colourful reports and dashboards make it a breeze to see how well the business is doing and if it’s hitting its goals. BI tools also play detective by combining info from different places, helping to spot areas that need improvement. They’re like a secret weapon, helping businesses keep an eye on trends and what customers like, giving them a leg up on the competition. Plus, they’re great at finding ways to save money and use resources better. With their crystal ball-like predictive abilities, these tools help plan for the future and avoid potential problems. Think of BI tools as the wise sidekick, making businesses smarter, more efficient, and ready for whatever comes their way.
Power BI overview:
In simple terms, Power BI is like a super-smart assistant for businesses. Imagine you have a pile of information scattered everywhere – Power BI helps gather all that data, organizes it neatly, and presents it in a way that makes sense. It’s like turning messy numbers and facts into clear, colourful pictures (charts and graphs) that tell a story. This makes it easy for people in a company to understand what’s going on and make smarter decisions based on the insights.
Components of Power BI Business Intelligence Tool:

Above pic showing Components of Power BI
Power Query
Power Query is a super useful tool in Power BI and Excel with some cool features. It lets you easily connect to different types of data, like spreadsheets or online databases. Once connected, you can make your data look just how you want it. Imagine you have a messy room, and Power Query helps you organize everything neatly. You can filter out what you don’t need, sort things, and even combine different piles of information. It’s like magic for cleaning up your data!
There’s a special language called “M” that lets you do even fancier things with your data if you want to get really creative. You can also see a preview of your changes at each step and go back if needed. It’s like having an undo button for your data transformations. Power Query is super handy for anyone who works with data because it’s easy to use, keeps track of what you’ve done, and makes your data look great for analysis and reporting.
Power Pivot
Power Pivot, found in Microsoft Excel and Power BI, revolutionizes data analysis. It elevates these tools into robust platforms for managing substantial datasets, empowering users to construct intricate data models and relationships. Leveraging in-memory processing, Power
Pivot expedites calculations and data retrieval, ensuring swift and dynamic insights. It facilitates the creation of sophisticated measures and calculations, transforming raw data into actionable intelligence. With seamless integration with Power Query and effortless connectivity, it becomes an indispensable tool for professionals aiming for advanced data analysis, business intelligence, and streamlined decision-making.
Power View
Power View, part of Microsoft’s Power BI and Excel, is a versatile tool for crafting vivid data visualizations. Users can effortlessly build interactive, captivating reports and dashboards, transforming intricate data into engaging narratives. With its intuitive features, it facilitates smooth data exploration, promoting deeper insights. Supporting diverse visual elements such as charts, tables, and maps, Power View empowers users to communicate and comprehend information effectively, elevating the overall experience of making decisions based on data.
Power Map
Power Map, part of Microsoft Excel and Power BI, is like a magic tool for turning flat data into interactive 3D maps and tours. You can place your data on dynamic maps, creating visually appealing displays that show trends and changes over time. With cool animations, it lets you explore how your data evolves. It’s not just about charts; it’s like taking your data on a journey, making it easy to grasp and share insights. So, whether you’re presenting or analysing, Power Map adds a spatial flair to your data, making it more engaging and helping you make better-informed decisions.
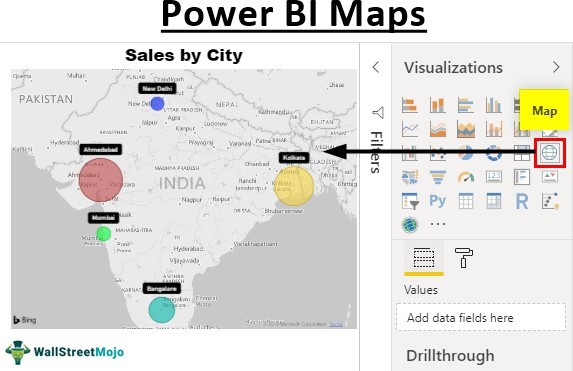
Demo pic showing power BI map (reference wallstreetmojo for image)
Power Q&A
Power Q&A, a feature in Microsoft Power BI, is your data conversation companion. It allows users to query and explore data using natural language, making data analysis intuitive. By simply typing questions, users can extract meaningful insights and receive instant visualizations. Power Q&A’s intelligent engine understands the context, enabling a conversational approach to data exploration, making it accessible to a wide range of users, regardless of technical expertise.
Power BI Desktop
Power BI Desktop is like the creative studio for data. It’s where you make cool charts, tables, and reports using an easy drag-and-drop style. You connect it to your data, shape it the way you want, and create interactive dashboards. It’s not just about numbers; you can turn your data into colourful stories. Once done, you can easily share your work with others. So, whether you’re a numbers pro or just getting started, Power BI Desktop helps you make sense of your data in a fun and straightforward way.
Power BI website
The Power BI website acts as the central platform for Microsoft’s Power BI, serving as the entry point for data analytics and business intelligence. Users can access Power BI services for collaboration, sharing, and exploring insights. The website allows the creation and management of Power BI workspaces, storing dashboards, reports, and datasets. It also features a marketplace for sharing and discovering pre-built content such as visuals and templates. With an intuitive interface, the Power BI website connects users to a dynamic ecosystem of tools and resources, facilitating efficient data-driven decision-making and fostering a collaborative community.
Power BI Mobile Apps
Power BI Mobile Apps bring your data wherever you are. Designed for both iOS and Android, these apps give you on-the-go access to your Power BI reports and dashboards. They keep
you connected, allowing you to engage with your data and make decisions from virtually anywhere. The apps provide a smooth and intuitive interface, ensuring easy visualization and analysis of your data. Whether you’re in a meeting or on the move, Power BI Mobile Apps empower you to stay in control and make informed choices, untethered from your desk.
Reporting and analysis
A Power BI report acts as a versatile tour guide through your dataset, showcasing various perspectives with visuals that unveil distinct findings and insights. Whether it’s a solo spotlight or a grand ensemble across multiple pages, each visual is like a story told by the data. Think of it as a personalized exhibition where charts, graphs, and tables paint a vivid picture, offering a dynamic exploration of your information. It’s not just a report; it’s a journey that lets you uncover valuable insights, making data analysis a captivating and enlightening experience.
Power BI presents data in a digestible format, enabling easy understanding of complex datasets. Customization ensures real-time updates without altering the dataset. Safe interaction is guaranteed, allowing changes to reports without impacting the underlying data. Visual aids enhance and reinforce dataset results seamlessly.
let’s take a stroll through the world of Power BI, where data becomes your storytelling canvas. Imagine Power BI as a wizard that turns your jumbled-up data into beautiful, interactive stories.
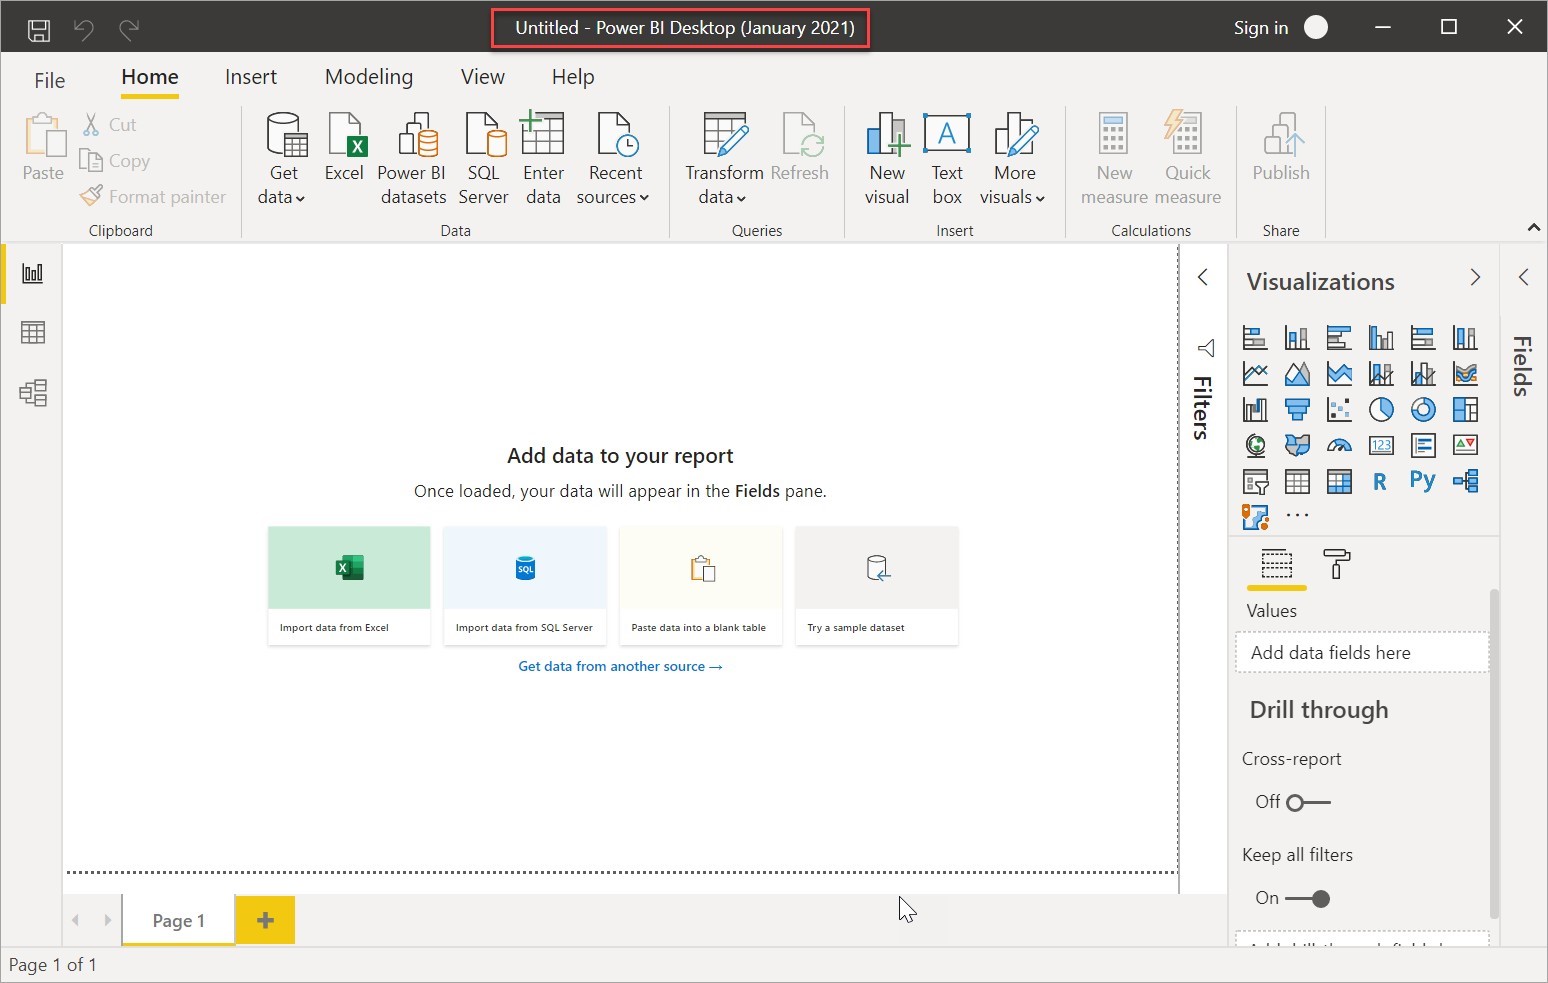
Above pic showing power BI interface
Connecting the Dots – Data Connection:
First things first, Power BI helps you gather all your scattered data from different places – it’s like summoning all your friends to a party. Whether your data is in Excel sheets, databases, or even floating in the cloud, Power BI is the superhero that brings everything together. Now, your data is in one room, ready for some serious mingling.
Tidying Up – Data Transformation:
Now, your data is like a room full of stuff – some useful, some not so much. Power BI helps you tidy up. It’s like having a magical organizer. Want to remove duplicates? Easy. Need to sort things alphabetically? Done. You can even combine different pieces of information, creating order from chaos. It’s like transforming a messy room into a cozy, well-arranged space.
Creating Relationships – Data Modelling:
Think of your data as a network of friends. Power BI helps you introduce them to each other. If one friend knows something about the other, Power BI connects them. This connection makes your data smarter. Now, your data isn’t just sitting there; it’s mingling and building relationships.
Crafting Visual Stories – Report Creation:
Now that your data is in order, it’s time to tell its story. Power BI lets you design visual reports, like crafting a comic book. You pick the characters – charts, graphs, and tables – and arrange them on the page. Each visual element tells a part of the story. Want to show how sales are going up? Add a rising chart. It’s like turning your data into a captivating picture book.

Dynamic Dashboards – A Real-Time Showcase:
Dashboards are like your data’s stage, where it performs in real-time. Power BI allows you to create dashboards that bring your visuals to life. It’s not just static; it’s a dynamic showcase of your data’s performance. Like a director, you decide which scenes (or data) take the spotlight.
Playtime – Interactivity:
Power BI is not just about watching; it’s about playing with your data. You can zoom in, zoom out, and click around to discover hidden details. It’s like having a magical magnifying glass that reveals insights when you look closer. You’re not just a spectator; you’re an explorer in the land of data.
Speaking the Language – Natural Language Queries:
Imagine if your data could understand plain English. Power BI’s got that covered. You can ask questions like you’re chatting with a friend. “Show me sales from last month.” Voila! The data responds with visuals, like a friendly genie fulfilling your wishes.
Sharing the Magic – Collaboration and Accessibility:
Now, you’ve created this magical data world, and you want to share it. Power BI lets you do that securely. Whether your friends are across the hall or across the world, they can access and interact with your reports. It’s like sharing a storybook – everyone gets to read and enjoy.
Keeping it Fresh – Scheduled Refresh:
Data is like a garden; it grows and changes. Power BI understands that. It lets you set up scheduled refreshes, ensuring your reports are always blooming with the freshest data. No wilting here; it’s a perpetual spring of information.
On-the-Go Adventures – Mobile Accessibility:
Imagine taking your magical data on adventures. Power BI’s mobile app lets you do just that. Whether you’re at a coffee shop or in a meeting, your data is right there in your pocket, ready for action. It’s like carrying a mini-magic wand of insights.

Power BI dashboard
A Power BI dashboard is like a visual command centre for your data. It brings together information from different places and turns it into interactive charts and graphs. This snapshot of key data lets you see trends, track goals, and make decisions at a glance. The dashboard is like a user-friendly map, guiding you through complex information with customizable visuals. It’s not just about numbers; it’s a dynamic, real-time overview that helps you understand and share important insights effortlessly, making your data-driven decision-making swift and effective.

Above a demo pic showing an example of Power BI dashboard
Power BI analysis
Power BI analysis is a dynamic journey that turns raw data into actionable insights. It all starts with connecting to diverse data sources, and then Power BI shapes and models the data, creating a solid foundation for deeper exploration. Using interactive visuals and analytics, it’s like being a detective, uncovering patterns and trends in the data. Power BI Desktop becomes your investigation board, allowing you to craft compelling narratives with charts and graphs. When it’s time to share your findings, Power BI ensures secure collaboration, reaching the right stakeholders. Scheduled refreshes maintain data accuracy, acting like ongoing surveillance in your investigation. The iterative nature of Power BI allows for continuous refinement of insights as new data emerges. Its commitment to data integrity ensures that changes in reports don’t compromise the underlying dataset, maintaining a secure and transparent analysis process. Ultimately, Power BI transforms data analysis into a visual storytelling experience, giving you the tools to make well-informed decisions based on a comprehensive understanding of your data.
Power BI embarks on a data discovery journey, playing the role of a detective in uncovering insights. Initiate the investigation by connecting to diverse data sources, much like a detective assembling evidence. Employ Power Query as your toolkit for refining and organizing data, ensuring a neat and structured foundation for analysis—a crucial step in the investigative process. Picture Power BI Desktop as your detective’s board, strategically placing visuals akin to key pieces of evidence.
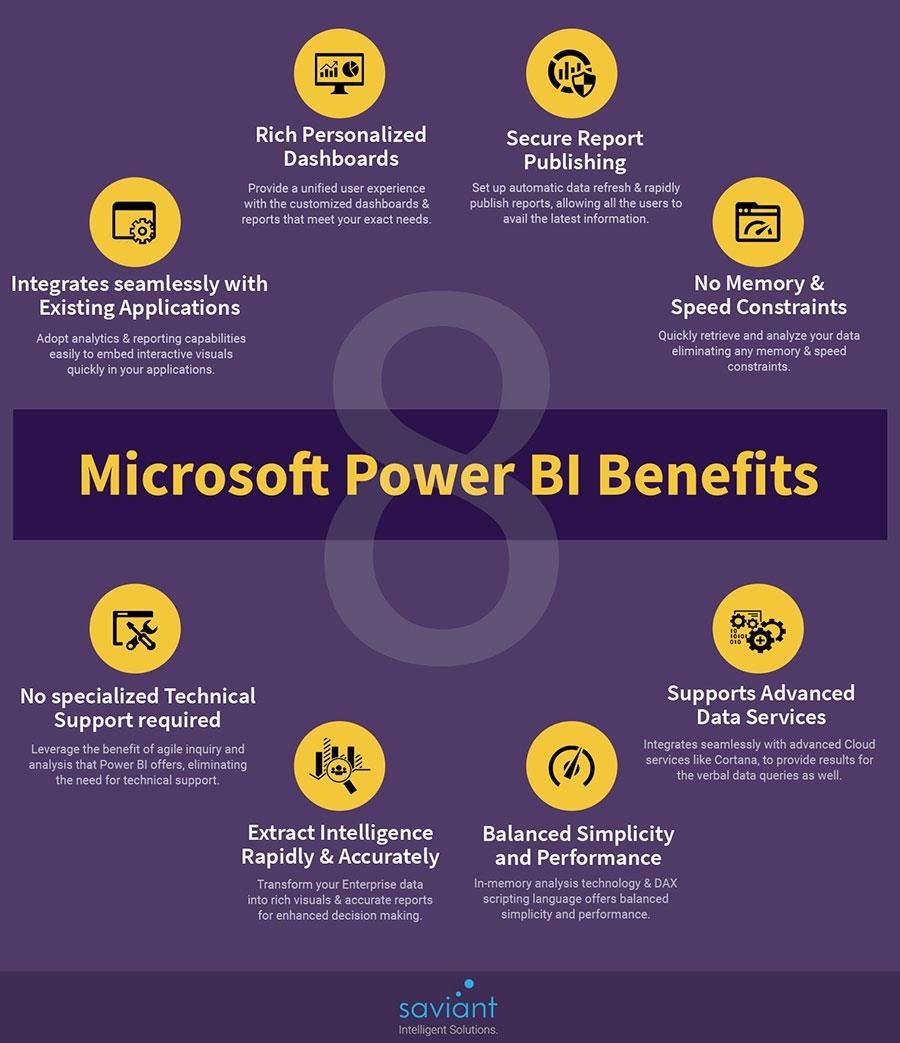
Above image showing Benefits of Power BI (reference saviant intelligent solutions pics)
Establishing relationships between data elements mirrors the detective’s method of building a strong investigative framework. Visualization becomes your narrative tool, transforming
data into a compelling story. The interactive elements function as your means of dynamic inquiry, extracting essential information on the fly.
Enabling forensic analytics through built-in features allows for a thorough examination of trends and patterns. Reports serve as your comprehensive case file, visually presenting findings. Secure sharing facilitates collaboration with stakeholders, simulating the detective’s team briefing.
Scheduled refreshes act as continuous surveillance, keeping your investigation up-to-date. An iterative approach allows for refinement with each revisit, ensuring the analysis evolves with emerging insights. Power BI’s commitment to data integrity ensures that reports remain distinct from the core dataset, preserving the investigative process’s integrity.
Ultimately, Power BI transforms the traditionally analytical into an engaging and enlightening experience, turning data into vivid stories. This investigative journey captures the essence of Power BI’s prowess, making data analysis an enthralling endeavour.
Conclusion
In the realm of business intelligence, Power BI emerges as a game-changer, offering organizations a powerful compass to navigate the vast ocean of data. Beyond being a mere reporting and analysis tool, Power BI is a dynamic force that converts raw data into actionable insights, paving the way for informed decision-making.
What sets Power BI apart is its ability to craft more than static reports; it weaves visual narratives that unfold the story within an organization’s data. Utilizing Power BI Desktop, users design interactive visuals, charts, and graphs, creating a canvas where data exploration becomes both insightful and effortless. This visual storytelling approach goes beyond conventional reporting, offering a holistic and captivating portrayal of crucial insights.

Power BI’s impact on business intelligence is underscored by its intuitive interface and dynamic capabilities. Acting as a data gateway, it seamlessly connects diverse data sources, providing a unified and comprehensive view of organizational information. Its prowess in shaping and transforming data through Power Query ensures a flexible foundation for ongoing analysis, adapting to the evolving data landscape.
Power BI’s strength extends into the realm of advanced analysis. Through built-in analytics features and the application of advanced calculations using the Data Analysis Expressions (DAX) language, Power BI elevates data into actionable intelligence. This level of analytics transcends observation, enabling businesses to anticipate trends, spot outliers, and make strategic decisions rooted in a comprehensive understanding of their data.
Collaboration is seamlessly integrated, fostering a team-centric environment where reports can be securely shared. Power BI supports natural language queries, democratizing data exploration and bridging the gap between technical and non-technical users.
Scheduled refreshes ensure that reports stay current, reflecting the latest information and maintaining the precision of insights. This real-time adaptability aligns with the dynamic nature of business data, ensuring decisions are based on the most up-to-date information available.
In essence, Power BI isn’t just a tool; it’s a catalyst propelling business intelligence into a new era. Its role in reporting and analysis goes beyond surface-level examinations, delving deep into the nuances of data and transforming it into a tangible asset for strategic decision- makers. By seamlessly integrating data shaping, visual storytelling, advanced analytics, collaboration, and real-time updates, Power BI emerges as a cornerstone in the evolving business intelligence landscape, empowering organizations to unlock the full potential of their data for sustainable growth.
References:
- Microsoft power BI website
- Google images
- Syskit website

Subscribe for next update
All Blogs
.png)
.png)