
Blog
Excel Mastery for Investment Banking: Financial Modeling Guide
Mastering Excel for Investment Banking: The Foundation of Financial Modeling
November 10, 2025
Learn essential Excel skills for investment banking in India. Master financial modeling, valuation, M&A analysis, and more to boost your finance career.
.avif)

If you have ever wondered what tools investment bankers use behind the scenes to evaluate companies, build valuation models, and advise billion-dollar clients, here's the answer: Microsoft Excel.
Excel might look like just another spreadsheet program, but in the investment banking world, it’s a financial powerhouse. From analyzing company data to projecting future profits, Excel helps bankers make smarter, faster, and more accurate financial decisions.
In this blog, we’ll break down why Excel is the backbone of investment banking, what makes it so powerful, and how you can use it to kick
-start your investment banking career in India.

The Real Role of Excel in the Finance World
Let’s start with the basics.
Most people use Excel for simple tasks — like tracking expenses or making charts. But in finance, it’s the engine that drives decision-making. Excel allows bankers to create financial models that simulate real business performance.
Think of Excel as a virtual lab for finance professionals. You can test what happens if a company’s sales grow faster, or if interest rates rise. These insights help bankers and analysts make investment decisions that move markets.
How Bankers Use Excel Daily:
Valuation: Estimating how much a company is worth.
Modeling: Building financial statements to forecast future performance.
Scenario Analysis: Testing “what-if” situations (like a market crash or new product launch).
Reporting: Turning raw data into clear, visual reports that executives can understand.
So when people say “bankers live in Excel,” they mean it literally — most analysts spend 6 to 8 hours a day working inside spreadsheets.
Why Excel Is the Foundation of Investment Banking Analysis
There are plenty of software tools available today — from Bloomberg Terminals to Python — but Excel remains the core analytical tool in investment banking.
Here’s why:
1. Flexibility for Custom Models
Every company and deal is unique. Excel lets analysts build custom models from scratch — whether it’s for a startup valuation or a merger deal.
Unlike software with rigid templates, Excel gives bankers full control over every formula, assumption, and layout.
2. Compatibility with Financial Databases
Investment banks rely heavily on databases like Bloomberg, Capital IQ, and Refinitiv for real-time financial data. Excel integrates smoothly with these systems, allowing analysts to pull live market data directly into their spreadsheets.
This means they can update models instantly — a must-have in fast-moving markets.
3. Real-Time Insights and Reporting
Excel’s formulas, charts, and pivot tables allow bankers to analyze data in real time. They can quickly test how changes in revenue or costs affect company value — and present the findings through dashboards or presentations.
4. Easy to Learn, Powerful to Master
While Excel seems simple at first, mastering it can transform your analytical ability. Many investment bankers start as Excel beginners and later use it to handle multi-million-dollar models.
5. Breaking the “Just a Calculator” Myth
Many people think Excel is “just for math.” In reality, it’s a strategic thinking tool.
For example, analysts can create detailed models that simulate how a company will perform in the next 5 years — and test how market changes, interest rates, or cost fluctuations will impact profitability.
That’s why Excel is often called the language of finance; it's where ideas meet numbers.
6. Core Financial Modeling Applications in Excel
Now that you understand why Excel matters, let’s explore how it’s actually used in financial modeling — the art and science of predicting a company’s future performance using data.
Financial modeling is one of the most essential skills for anyone looking to build an investment banking career. It’s what helps bankers value companies, analyze investments, and advise clients.
A. Building Integrated Financial Statements
At the heart of every financial model are the three main financial statements:
- Income Statement – shows a company’s revenues, costs, and profits.
- Balance Sheet – shows what the company owns (assets) and owes (liabilities).
- Cash Flow Statement – tracks how money moves in and out of the business.
In Excel, bankers build these statements from scratch and link them together.
This linking process ensures that every number connects logically. For example:
- If sales increase, profit should increase.
- If a company buys equipment, cash should decrease, but assets should rise.
This interconnection helps analysts see the big picture of how different business activities affect the company’s financial health.
Example:
Imagine a company launches a new product. You can use Excel to project how much revenue it will generate, how it affects expenses, and how it ultimately impacts net profit.
B. Importance of Linking and Consistency Checks
In professional financial models, accuracy is everything. That’s why analysts use consistency checks — formulas that verify all numbers align properly.
For instance:
- Assets = Liabilities + Equity
- Cash at the end of the year in the cash flow statement must match the cash balance on the balance sheet.
If these don’t align, it’s a red flag — meaning there’s an error in the model. Consistency checks save bankers from making costly mistakes in real-world deals.
C. Forecasting and Scenario Analysis
Forecasting is the process of predicting future performance based on assumptions. In Excel, this means using formulas to project revenue, expenses, and profits for the next few years.
Bankers often build multiple scenarios — for example:
- Best Case: Sales grow rapidly.
- Base Case: Average growth.
- Worst Case: Market slowdown.
Excel tools like Goal Seek and Scenario Manager help visualize these outcomes quickly.
How These Tools Work:
- Goal Seek: You set a target (e.g., desired profit), and Excel tells you what revenue is needed to achieve it.
- Scenario Manager: Lets you compare different financial assumptions side by side — like changes in interest rates or sales volume.
These tools help investment bankers test assumptions and make more confident recommendations.
D. Real-Life Example: Creating a Revenue Forecast
Let’s take a simple example.
Suppose you’re analyzing a listed company, like Tata Motors, and you want to project its future revenue.
You could use Excel to:
- Pull historical data from the company’s annual reports.
- Calculate the average growth rate of revenue.
- Apply that growth rate to forecast future sales.
- Adjust assumptions for economic changes or market trends.
In just a few minutes, Excel can turn raw data into a clear, professional projection that tells a powerful story.
E. Sensitivity Analysis: Testing Your Assumptions
One of the most important parts of financial modeling is sensitivity analysis — testing how sensitive your model’s results are to small changes in assumptions.
For instance:
- What happens if the interest rate increases by 1%?
- How does profit change if costs rise by 5%?
In Excel, this can be done using data tables and scenario tools that instantly show how key outcomes (like profit or valuation) change with different inputs.
This helps bankers prepare for uncertainty — a vital skill in volatile markets.

4. Key Excel Tools Every Finance Professional Should Know
If you’re starting your investment banking journey, mastering certain Excel tools will give you an edge. Here are a few essential ones:
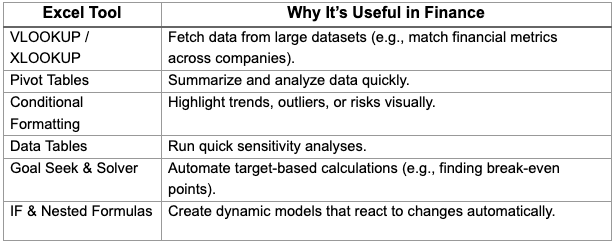
When combined, these tools help you move from simple analysis to decision-driven modeling — a key skill every investment banker must master.
5. Why Excel Skills Boost Your Investment Banking Career
If you’re aiming for a career in investment banking in India, Excel is your stepping stone. Here’s why mastering it matters:
1. Core Skill for Entry-Level Roles
Most investment banking jobs for analysts and associates require advanced Excel skills. It’s the tool you’ll use to analyze deals, build pitch books, and support client presentations.
2. Increases Efficiency and Accuracy
Knowing shortcuts and formulas can save hours of work. Analysts who can deliver fast and accurate reports quickly stand out in their teams.
3. Foundation for Advanced Skills
Once you’re comfortable with Excel, you can move to financial modeling, valuation techniques, and even programming tools like Python or VBA.
4. Direct Impact on Earning Potential
Strong Excel and modeling skills often translate to higher investment banker salaries because they make you more valuable to your firm.
In India, a beginner investment banking analyst can earn between ₹8–15 LPA, while skilled professionals at top investment banks like Goldman Sachs, JP Morgan, or Kotak Mahindra can earn much more with experience.
6. The Role of Excel in Top Investment Banks in India
Top investment banks in India, such as:
- JP Morgan India
- ICICI Securities
- Axis Capital
- Goldman Sachs
- Kotak Investment Banking
- Edelweiss Financial Services
all rely on Excel-driven models to evaluate deals, raise capital, and conduct valuations.
Even though they use advanced platforms, Excel remains the first step in every analysis. It’s where junior analysts prove their technical and analytical ability.
7. How to Learn Financial Modeling and Excel for Investment Banking
If you want to learn how to become an investment banker, here’s a roadmap to get started:
Step 1: Master Excel Fundamentals
Learn basic formulas, formatting, and shortcuts. Build comfort with financial data organization.
Step 2: Learn Financial Statements
Understand how income statements, balance sheets, and cash flow statements connect.
Step 3: Practice Financial Modeling
Start creating 3-statement models in Excel. Use company data from sources like Moneycontrol or NSE India.
Step 4: Study Valuation Techniques
Learn methods like DCF (Discounted Cash Flow), Comparable Company Analysis, and Precedent Transactions — all built in Excel.
Step 5: Get Certified or Trained
Enroll in structured investment banking or financial modeling courses. Hands-on projects are the best way to learn.

Step 6: Apply for Internships or Analyst Roles
Start your career journey with real-world exposure. Your Excel skills will help you stand out.
8. Common Myths About Excel in Investment Banking
Let’s bust a few myths that hold beginners back:
The truth is, Excel isn’t just about numbers — it’s about storytelling through data.
Role of Excel in Valuation
Excel is the most widely used tool and truly one of the most important tools for modeling and valuation in Investment Banking. Excel allows analysts to forecast revenue , financial statements and analyze company’s performance. Of course it is Excel's functions and formulas that make it possible for analysts to calculate future cash flows , compute present value of the company’s shares using different approaches. Excel has so much more role than normal people can think of.
In Investment Banking , Excel is the foundation for:
- Preparing valuation ( DCF , trading comps , M&A) models.
- Performing sensitivity analysis.
- Creating visual representation like charts and dashboards to present to clients.
DCF( Discounted cash flow) Excel Model
- DCF method calculates the value of company’s shares based on future cash flows discounted back to today.
So analysts use excel to forecast revenues , expenses , taxes and capital
expenditures which are used to calculate FCFF( Free Cash Flow to the Firm) of a
company.
FCFF = EBIT*(1-tax rate)+ Dep.&Amor. + Net changes in Working capital - CapEx
- WACC (Weighted Average Cost of Capital) formula is:
= Wd* Rd*(1-tax rate)+ We*Re
Where,
- Wd/We= Weight of debt / Weight of equity , that is , proportion of debt and equity in capital structure.
- Rd= Cost of Debt
- Re= Cost of Equity
Excel allows linking live data , that is , interest rates , risk free rates and beta values for accuracy.
- Once the Future cash flows and Wacc is determined:
Terminal value is calculated using Gordon growth model and Exit multiple method.
Present value of projected cash flows and terminal value is calculated using Excel
function NPV() or XNPV().
Now this will give us the Enterprise Value of the company , from which intrinsic value can be known.
Comparable Company Analysis ( Trading comps)
In this method , we use different types of market multiples. So it determines a business’s worth by examining the present trading multiples of similar publicly traded companies. All else being equal , businesses sharing similar attributes are expected to have similar valuation.
- Using market multiples
Commonly used multiples are:
- P/E
- EV/EBITDA
- EV/EBIT
- EV/Sales
- P/BV
In excel , analysts maintain all these multiples of peer companies for quick comparison with peers , using functions like average(range) or median(range).
- Benchmarking with comparable companies
- Now the charts and conditional formatting in Excel helps us know whether the company is trading at a discount or at a premium compared to the peers.
- The average or median multiple is applied to the target company’s financials to evaluate its valuation range .
Precedent Transaction Analysis
This method looks at the valuation for similar peer companies in recent transactions. Previous buyers set the acquisition prices , so this technique gives their collective view.
- Historical Deal Data
- Excel helps record deal value, EBITDA, revenue, and acquisition multiples from historical transactions.
- Data is organized in tables for easy filtering and analysis.
- Valuation Range Estimation
- Analysts calculate the average and median transaction multiples (EV/EBITDA).
- These multiples are then put into the target company’s financial figures to obtain a valuation range.
- Excel’s data tables and scenario analysis tools are used to alter assumptions.
Excel in Merger & Acquisition(M&A)
Excel plays a major role in examining and obtaining mergers and acquisitions by permitting analysts to model the financial impact of a proposed deal.
The primary purpose of an M&A model in Excel is to determine whether the acquiring company’s shareholders will benefit from the transaction.
Purpose of M&A Models in Excel
- Evaluate the purchase price and financing structure (cash, stock, or debt).
- Analyze the financial performance of both companies before and after the merger.
- Assess synergies, accretion/dilution, and value creation resulting from the deal.
Synergy Analysis and Combined Financial Statements
A crucial part of any merger model involves estimating synergies—the additional benefits that arise when two companies combine their operations.
Common types of synergies analyzed in Excel include:
- Revenue Synergies: Enhanced sales, market expansion, or cross-selling opportunities.
- Cost Synergies: Savings from economies of scale, removal of redundant functions, or optimized resource use.
Excel is used to:
- Prepare pro forma financial statements (income statement, balance sheet, and cash flow statement) that show the financial position of the merged entity.
- Incorporate synergy impacts into revenue and cost projections.
- Account for one-time transaction expenses and integration costs that occur during the merger process.
Accretion/Dilution Analysis and Impact on EPS
Another key element of an M&A model is accretion/dilution analysis, which measures how a merger affects the acquirer’s Earnings Per Share (EPS).
- Accretion: The merger increases the acquirer’s EPS — considered favorable.
- Dilution: The merger reduces EPS — potentially unfavorable for shareholders.
Using Excel, analysts can compare the combined (pro forma) EPS with the standalone EPS of the acquiring company. Since formulas are interlinked, any change in deal assumptions—such as financing mix or synergy levels—automatically updates the EPS outcome, helping analysts test multiple scenarios quickly.
Steps in Building a Basic Merger Model
A simple M&A model in Excel generally includes these steps:
- Set Input Assumptions:
Define the purchase price, exchange ratio, financing method, and expected synergies. - Project Financials:
Forecast income statements and key financials for both the acquiring and target companies. - Prepare Combined Statements:
Build pro forma financials by merging the two sets of projections and including synergy adjustments. - Calculate Goodwill:
= Purchase Price - Fair value of net assets acquired
5. Incorporate Financing Effects:
Add the impact of new debt, interest expenses, and newly issued shares (in case of New stock deal)
6. Run Accretion/Dilution Analysis:
Compare pre- and post-merger EPS to assess whether the deal adds or destroys value.
Leveraged Buyout (LBO) Modeling
1. Introduction to LBO and Excel’s Role
A Leveraged Buyout (LBO) is a type of acquisition where a company is purchased primarily using borrowed funds (debt). The assets and future cash flows of the target company are often used as collateral to secure the financing. The goal is to achieve high returns on equity by using leverage effectively.
In the world of investment banking and private equity, Excel is the most essential tool for performing LBO financial modeling. Analysts use Excel to evaluate the feasibility, profitability, and risk associated with a buyout. Excel allows for complex structuring of financing layers, building debt schedules, forecasting cash flows, and calculating investor returns.
LBO models in Excel are built to answer critical questions such as:
- What price can be paid for the target company?
- How much debt can the deal support?
- What are the expected IRR (Internal Rate of Return) and cash-on-cash multiple?
- How sensitive are returns to changes in exit assumptions or financing costs?
Through advanced Excel valuation techniques, analysts can simulate various deal structures, assess downside scenarios, and determine whether the transaction meets investor expectations.
LBO Model Structure and Excel Setup
An LBO model structure follows a systematic layout in Excel, combining multiple financial and analytical components. A clean and organized Excel setup ensures transparency and flexibility in analyzing deal outcomes.
A standard LBO model consists of the following key sections:
- Assumptions Sheet – Includes purchase price, financing structure, interest rates, exit multiples, and operational forecasts.
- Sources & Uses Table – Shows how the deal is financed (sources) and how the funds are spent (uses).
- Sources: Debt tranches, investor equity, and other financing.
- Uses: Purchase price, transaction fees, debt repayment, and other adjustments.
- Sources: Debt tranches, investor equity, and other financing.
- Financial Forecasts – The income statement, balance sheet, and cash flow projections of the target company for 5–7 years.
- Debt Schedule – A detailed breakdown of principal repayments, interest expense, and outstanding balances.
- Cash Flow Waterfall – Illustrates how operating cash flows are allocated between debt repayment, interest, and equity holders.
- Exit Assumptions & Returns Calculation – Determines investor returns (IRR and multiple on invested capital).
Excel’s grid-based structure and formula linking make it ideal for modeling these components. Functions such as PMT(), IRR(), XIRR(), and NPV() are frequently used in LBO financial modeling to analyze financing flows and returns.
Debt Schedule and Cash Flow Waterfall
A debt schedule is one of the most critical parts of an LBO model. It tracks the different layers of debt, interest rates, and repayment timelines. In Excel, the schedule is usually organized by year (or quarter) and includes the following elements:
Debt Type
Opening Balance
Interest Expense
Principal Repayment
Closing Balance
Common layers of debt in an LBO:
- Senior Debt: Lowest cost, highest priority in repayment.
- Mezzanine Debt: Higher interest rates, often includes equity warrants.
- Subordinated Debt: Riskier layer with flexible repayment structure.
Excel’s cell-linking capabilities allow automatic updates to interest and repayment values when assumptions (like interest rate or debt proportion) are changed.
The cash flow waterfall represents how the company’s available cash is distributed:
- Operating Cash Flow → used first for interest payments.
- Remaining cash → used for scheduled principal repayment.
- Excess cash → may go toward optional prepayments, dividends, or exit distributions to investors.
Excel formulas ensure that every rupee of cash flow is accounted for and that the balance sheet balances perfectly at every stage.
Calculating IRR and Payback Period
The Internal Rate of Return (IRR) and payback period are key performance measures in an LBO model. They determine how attractive the investment is for private equity investors.
- IRR represents the annualized rate of return an investor earns on invested capital, considering both the timing and amount of cash flows.
IRR=Rate where NPV of all cash flows = 0IRR = \text{Rate where NPV of all cash flows = 0}IRR=Rate where NPV of all cash flows = 0
In Excel, the IRR() or XIRR() function is used.
Example:
=XIRR(Cash_Flow_Range, Date_Range)
If the calculated IRR is above the investor’s hurdle rate (say 20–25%), the deal is considered financially viable.
The payback period measures how long it takes for investors to recover their initial equity investment. Excel allows analysts to track cumulative cash flows to determine the exact year when the payback occurs.
For example, if an investor puts in ₹500 crore and receives ₹750 crore at exit after 5 years, the IRR might be around 20% and the payback period 3.5 years.
By changing assumptions such as the exit multiple, debt interest, or holding period, Excel instantly recalculates these metrics—making scenario analysis easy and efficient.
How Excel Helps Assess Risk and Return in LBOs
An LBO model involves high leverage, which naturally increases financial risk. Excel helps in quantifying and managing these risks through detailed sensitivity and scenario analysis.
a. Sensitivity Analysis
Excel’s Data Tables and Scenario Manager tools allow analysts to test how variations in key assumptions—such as exit multiple, EBITDA growth, or interest rate—affect returns (IRR, multiple on invested capital).
For example:
- If there are multiple drops from 10x to 8x, what happens to IRR?
- If debt interest increases by 1%, does the deal still meet target returns?
b. Scenario Analysis
Analysts can build different cases—Base, Upside, and Downside—to capture a range of possible outcomes.
Each scenario links to different assumptions for growth, margins, and leverage, and Excel instantly recalculates all outputs.
c. Debt Capacity and Coverage
Excel is also used to compute leverage ratios and coverage ratios like:
Debt/EBITDA, Interest Coverage (EBITDA/Interest Expense), Debt/Equity
These metrics indicate whether the target company can handle its debt burden over time. Conditional formatting can highlight when ratios breach safe thresholds.
d. Graphs and Dashboards
Using charts and dashboards, Excel provides visual insights into:
- Debt repayment over time
- Cash flow allocation (waterfall chart)
- IRR sensitivity to key assumptions
This allows private equity professionals to communicate results clearly to investors and stakeholders.
Importance of Excel in Investment Banking
Excel stands as the backbone of financial modeling and valuation in investment banking. Whether it is conducting valuation in Excel, performing DCF excel model analysis, preparing M&A excel models, or executing LBO financial modeling, Excel is the tool that enables analysts to turn raw financial data into meaningful insights and strategic decisions. It provides the precision, flexibility, and analytical depth needed to evaluate complex financial transactions, forecast company performance, and assess the true value of a business.
The strength of Excel lies in its ability to handle vast datasets, apply dynamic formulas, and connect multiple financial statements to create an integrated model. In valuation analysis, Excel enables professionals to estimate a company’s intrinsic value using methods such as the Discounted Cash Flow (DCF) approach. Through DCF excel models, analysts forecast revenues, expenses, taxes, and capital expenditures to calculate Free Cash Flow to the Firm (FCFF). These cash flows are then discounted at the Weighted Average Cost of Capital (WACC) to determine the present value of the company. Excel not only simplifies this process through automated formulas but also allows for sensitivity analysis—helping bankers understand how changes in assumptions such as growth rates, discount rates, or terminal values affect the overall valuation.
When it comes to Mergers and Acquisitions (M&A), Excel’s role becomes even more dynamic. An M&A excel model integrates financial statements of the acquiring and target companies to evaluate the transaction’s impact on shareholder value. It facilitates synergy analysis, where analysts estimate potential cost savings or additional revenues arising from the merger. Excel also helps perform accretion/dilution analysis, which shows whether the transaction will increase or decrease the acquiring firm’s Earnings Per Share (EPS). By linking all variables—deal structure, financing method, synergy assumptions, and tax effects—Excel instantly reflects how changes in any input affect the deal outcome, making it an indispensable decision-making tool in corporate finance.
In more advanced financial transactions, such as Leveraged Buyouts (LBOs), Excel’s importance multiplies. LBO financial modeling involves analyzing how a company can be acquired primarily through debt financing and how the investor can achieve an attractive return on equity. In this model, Excel helps structure multiple layers of debt, build a detailed debt schedule, and design a cash flow waterfall that shows how available cash is distributed to lenders and equity investors. The platform also enables calculation of key metrics like the Internal Rate of Return (IRR) and payback period, which are critical in determining the success of an LBO deal. Moreover, Excel’s scenario and sensitivity analysis tools allow analysts to test various assumptions related to leverage, interest rates, and exit valuations—providing a robust understanding of risk and return.
Overall, Excel is far more than just a spreadsheet tool; it is the language of finance in investment banking. Its functions, formulas, and visualization capabilities transform complex data into actionable insights. Whether for valuation, M&A, or LBO modeling, Excel serves as the foundation for financial analysis, helping bankers and analysts make data-driven, strategic decisions. Its flexibility, accuracy, and analytical power make it irreplaceable in the financial world, ensuring that every valuation and investment decision is backed by solid quantitative evidence.

The Role of Excel in Investment Banking: Advanced Use, Decision Tools & the Future Outlook
Section 1: Advanced Excel Use in Investment Banking
Why Excel Is Still the Backbone of Investment Banking
When you think of investment banking, the first things that come to mind are billion-dollar deals, financial models, and complex valuations. But behind every model and transaction, there’s one constant tool that bankers can’t live without — Microsoft Excel.
Despite the rise of sophisticated data tools and analytics software, Excel remains the foundation of financial analysis, modeling, and decision-making across top investment banks in India and globally. Whether you’re working at a large firm like Goldman Sachs or a boutique bank in Mumbai, Excel is the language every analyst speaks.
It’s not just a spreadsheet program — it’s the engine that powers valuation models, merger analyses, and deal presentations. Investment bankers use it daily to structure data, perform financial forecasting, and make sense of enormous datasets in a way that’s fast, visual, and reliable.
Why Investment Bankers Depend on Excel
Investment banking is all about precision, time, and accuracy. Bankers often work under extreme deadlines — building models that may decide whether a merger or acquisition deal is worth billions.
Here’s why Excel continues to dominate investment banking workflows:
- Speed and flexibility: Excel allows analysts to build and adjust financial models quickly. You can update assumptions, tweak formulas, and instantly see the impact on valuation.
- Universality: Every finance professional — from analysts to CFOs — understands Excel. This makes it easier to collaborate and share models.
- Custom modeling: Unlike rigid software, Excel enables bankers to design custom models for any company, sector, or scenario.
- Integration: Excel connects seamlessly with data sources, PowerPoint, and visualization tools, making it easy to present insights directly to clients or stakeholders.
In short, Excel gives bankers the perfect mix of control, accuracy, and creativity — something no other tool matches.
How Excel Transforms Time-Consuming Tasks
Let’s consider a real-life example. Imagine an analyst is tasked with calculating the Weighted Average Cost of Capital (WACC) for a company using only a calculator and notes. Doing this manually — gathering beta values, debt ratios, and risk-free rates — could take hours.
Now, imagine the same task in Excel. With automated formulas, pre-linked data sheets, and references, the same calculation can be completed in just a few minutes.
This speed doesn’t just save time; it helps analysts focus on the strategic insights behind the numbers rather than wasting time crunching them.
Another example:
- Without Excel: Creating 5-year revenue projections by hand can take nearly a day, especially if multiple business segments are involved.
- With Excel: Prebuilt financial models can automatically forecast revenues based on assumptions, growth rates, and historical data, reducing hours of work to minutes.
That’s why in investment banking, Excel isn’t just a skill — it’s a productivity multiplier.
Real-Life Example: Efficiency in Deal Execution
In a real M&A (Merger and Acquisition) scenario at a mid-sized Indian bank, analysts were building valuation models for a pharmaceutical company acquisition. Initially, manual calculations and scattered data caused delays of 2–3 days in preparing due diligence reports.
After restructuring the process using Excel linking balance sheets, income statements, and cash flow statements into one integrated model the turnaround time dropped to less than 8 hours. This improvement allowed the team to respond faster to client queries, make real-time adjustments during negotiations, and close the deal sooner — giving their firm a strong competitive edge.
This is the kind of operational efficiency that makes Excel an irreplaceable tool in investment banking.
Referencing Techniques and Model Hygiene
In investment banking, small errors can lead to million-dollar misjudgments. That’s why proper referencing and model hygiene are critical when using Excel.
Here’s how professionals maintain accuracy and consistency:
- Structured referencing: Instead of typing numbers directly into formulas, analysts link data through cell references. This ensures that when data updates, all connected calculations change automatically.
- Consistent labeling: Every worksheet and input cell is clearly named — for example, “Revenue_FY2025” — making the model easy to audit.
- Color coding: Inputs, calculations, and outputs are color-coded (like blue for assumptions, black for formulas, green for links) to avoid confusion.
- Audit trails: Analysts track formula dependencies using Excel’s built-in audit tools, helping detect circular references or errors early.
Such practices not only reduce human errors but also make the model transparent and easy to review — especially during client presentations or peer evaluations. Think of referencing as the grammar of financial modeling. Without it, your model may look good but won’t stand up to real-world scrutiny.
The Value of Model Cleanliness
Investment bankers often pass Excel models between multiple team members — analysts, associates, and VPs — before they reach clients.
A model built with sloppy references, inconsistent naming, or hidden data can waste hours and even derail an important deal review.
That’s why banks emphasize model hygiene as a core part of analyst training. Clean, well-referenced models mean faster collaboration, easier auditing, and a stronger reputation for accuracy — something every aspiring investment banker should take seriously.
Excel’s Place in Investment Banking Workflows
From IPO valuations and discounted cash flow (DCF) analysis to leveraged buyout (LBO) and merger modeling, Excel plays a role at every stage of an investment banker’s workflow.
- Analysts gather and clean raw financial data in Excel.
- They build interconnected models to simulate different business outcomes.
- Results are visualized and shared with senior bankers or clients for decision-making.
This versatility is why Excel continues to be the first and last tool every investment banker opens during their day. It’s not about memorizing shortcuts — it’s about understanding how to use Excel to tell a financial story that drives billion-dollar decisions.
Section 2: - Excel as a Decision-Making and Presentation Tool
From Data to Decision: Excel’s Strategic Power
Investment banking is built on data-driven decisions. Whether evaluating a merger, structuring a buyout, or advising on an IPO, every banker’s judgment relies on numbers — and those numbers live in Excel. But Excel isn’t just a tool for calculation; it’s a decision-making platform. It turns massive, raw financial data into insights that influence billion-dollar negotiations. When used strategically, Excel helps investment bankers analyze risk, forecast performance, and visually communicate complex results to clients and management teams.
Let’s break down how Excel becomes a silent yet decisive partner in critical financial decisions.
Stress Testing and Scenario Analysis: Predicting the “What Ifs”
In investment banking, uncertainty is the only constant. Markets fluctuate, regulations shift, and company performance varies often unpredictably. That’s why stress testing and scenario simulations are crucial.
Excel gives bankers the flexibility to simulate hundreds of potential outcomes all at the click of a button.
Example: Merger Scenario Simulation
Imagine an investment bank evaluating a merger between two manufacturing firms. The analysts use Excel to model different scenarios:
- Best-case: 12% revenue growth and cost synergies realized.
- Base-case: 8% growth with moderate cost savings.
- Worst-case: 5% growth with delayed synergy capture.
Each scenario automatically adjusts enterprise value, debt ratios, and expected shareholder returns.
A small change in the cost of capital — say from 10% to 10.5% — could alter the deal’s net present value by ₹80–100 crores.
Without Excel’s sensitivity and scenario tools, evaluating these outcomes manually would take days.
Real-World Use Case
During a live M&A negotiation, an Indian investment bank’s deal team ran multiple stress tests on Excel to analyze how foreign exchange volatility could affect deal value. Earlier, such recalculations took nearly three hours per iteration; automation and scenario tables reduced this to under 15 minutes, enabling real-time decision-making during the client meeting.
This speed and adaptability make Excel indispensable for risk management and negotiation strategy.
Sensitivity Analysis: Finding the Tipping Point
Sensitivity analysis — another core Excel function — helps bankers understand how sensitive a deal’s valuation is to small changes in assumptions like discount rates, growth, or margins.
For instance, a DCF valuation might show that increasing WACC by just 0.5% reduces company value by ₹25 crores.
This helps analysts identify “pressure points” where a deal could become unattractive and plan accordingly.
Excel’s built-in Data Tables and Goal Seek functions make it easy to test these variables quickly, empowering decision-makers to act based on facts rather than intuition.
Data Visualization: Turning Numbers into Stories
Finance is a numbers game — but decisions are made through stories.
Investment bankers must transform data into a narrative that clients, boards, or investors can grasp quickly. This is where Excel’s visualization capabilities shine. With charts, conditional formatting, and interactive dashboards, Excel allows analysts to present data in a visually compelling way — helping clients see what truly matters.
Example: Dashboard for an IPO Analysis
A team preparing an IPO valuation created a dynamic Excel dashboard that displayed:
- Revenue growth by business segment
- Historical EBITDA margins
- Comparable company valuations
- Sensitivity to market conditions
Instead of scrolling through endless sheets, the managing director could toggle between scenarios and instantly visualize the company’s fair value range.
This not only saved time but also improved client confidence, turning complex valuation data into clear, boardroom-ready visuals.
Conditional Formatting: Instant Insight through Visual Cues
Conditional formatting is one of the simplest yet most powerful Excel tools. It highlights trends, outliers, and risk areas automatically.
In an investment banking context, analysts use it to:
- Highlight declining profit margins in red.
- Mark covenant breaches in loan models.
- Flag unusually high leverage or negative cash flows.
These visual cues help teams spot problems before they escalate, ensuring decision-makers focus on what truly matters.
For example, in a leveraged buyout (LBO) model, conditional formatting can instantly show when debt repayment coverage falls below a critical threshold — prompting early intervention and better risk mitigation.
Excel Dashboards: The New Boardroom Tool
Dashboards have revolutionized how bankers present financial insights.
Instead of presenting bulky spreadsheets or 30-slide decks, analysts now use interactive Excel dashboards to communicate results visually.
Features of an Effective Dashboard
- Key Performance Indicators (KPIs): Revenue, EBITDA, leverage ratio, and ROI at a glance.
- Interactive Filters: Users can change scenarios, periods, or assumptions dynamically.
- Color-coded visuals: Green for positive growth, red for risk zones.
- Automated updates: Data linked from live sheets or APIs ensures real-time accuracy.
Real Case Example
A boutique investment bank in Bengaluru created an M&A performance dashboard using Excel for one of its healthcare clients.
Instead of a 20-page report, the CEO received a single interactive sheet showing how changes in EBITDA margin affected valuation multiples.
What once took two days to prepare was done in two hours — and the client praised the clarity of presentation.
Such dashboards have become a signature of professional financial storytelling.
Excel + PowerPoint Integration: A Match Made in Banking
In every major investment bank, analysts prepare “pitchbooks” — PowerPoint presentations summarizing valuation analyses and deal recommendations.
A frequent pain point used to be manual updating — analysts spent hours changing numbers across slides when assumptions changed in Excel.
Today, Excel integrates seamlessly with PowerPoint. By linking charts and tables directly, any update in the Excel model automatically reflects in the slides.
Example of Workflow Efficiency
An analyst team working on a ₹1,200 crore acquisition once needed nearly 2 hours to update PowerPoint slides after model revisions.
After linking their Excel workbook to PowerPoint, the same task took under 15 minutes, reducing stress and ensuring 100% consistency.
This integration streamlines workflows, prevents data mismatches, and allows more time for strategy discussions rather than formatting slides.
Creating Client-Ready Outputs
In investment banking, presentation is as important as precision.
A polished Excel model reflects the analyst’s professionalism and strengthens client trust.
Here’s what differentiates a client-ready model from a working draft:
- Clear input and output separation — Inputs on one sheet, results on another.
- Color coding — Blue for user inputs, black for formulas, green for linked data.
- Comprehensive documentation — Notes explaining key assumptions and methodologies.
- Summarized outputs — Tables and graphs ready for inclusion in presentations.
For instance, a DCF valuation might end with a clean summary table showing enterprise value, equity value, and implied share price — formatted for direct use in investor presentations.
Such models not only communicate insights clearly but also make a lasting impression on clients and partners.
Section 3: - Challenges, Limitations, and The Future of Excel in Investment Banking
Understanding Excel’s Limitations: Why Even the Best Tool Needs Care
No tool is perfect, not even Excel.
Despite being the backbone of investment banking, Excel has certain limitations that professionals must understand and manage carefully.
In a field where even a misplaced decimal can shift valuations by millions, accuracy, consistency, and auditability are non-negotiable.
Recognizing where Excel can falter and how to prevent those risks separates an average analyst from a great one.
1. Human Error: The Hidden Cost of Manual Work
One of Excel’s biggest strengths and flexibility is also its greatest weakness. Because anyone can edit a cell, it’s easy for mistakes to creep in unnoticed.
For example, a European investment bank once faced a valuation error worth millions when an analyst accidentally added an extra zero in a debt assumption cell. The oversight inflated the company’s value and almost disrupted deal negotiations.
While such cases are extreme, smaller errors are common wrong references, broken links, or overwritten formulas. These mistakes can spread across multiple sheets, making them hard to trace.
How Investment Banks Reduce Human Error
- Model hygiene checklists: Before finalizing, every model undergoes a structured review process.
- Color-coding conventions: Inputs in blue, formulas in black, and links in green for instant clarity.
- Data protection: Locking critical cells and using password-protected sheets to prevent accidental changes.
- Peer review: Having another analyst cross-check models for accuracy.
In short, the best bankers don’t just build models — they audit them like engineers.
2. Version Control and Collaboration Issues
Investment banking deals often involve multiple people working on the same model — analysts, associates, VPs, and even external consultants.
Without a proper version control system, teams may end up working on outdated files, leading to confusion and conflicting outputs.
A senior associate from a Mumbai-based investment firm once shared how, during a major IPO project, they discovered three different versions of the same model circulating among teams. Reconciling the changes took an entire day, delaying the client presentation.
How the Best Firms Handle It
- Use centralized cloud storage (like OneDrive or SharePoint) where all changes are tracked in real time.
- Maintain a version history — so previous models can be reviewed or restored easily.
- Clearly label file versions (e.g., “v1.2_PreReview” or “v3_Final_Approved”).
With today’s cloud-based Excel, teams can work simultaneously on the same file — eliminating confusion and improving transparency.
3. Efficiency Challenges with Large Datasets
When handling small company valuations or moderate datasets, Excel performs beautifully.
But in cases like market trading analysis, private equity portfolio reviews, or macroeconomic datasets with millions of data points, Excel can slow down or even crash.
For example, one global investment bank tried using Excel to analyze millions of bond trades — the file exceeded 500MB and became nearly unusable. They later shifted to an integrated SQL database for data storage, while continuing to use Excel as the front-end analysis tool.
Optimizing Excel Performance
- Break large datasets into multiple linked workbooks.
- Avoid volatile functions that constantly recalculate.
- Use filters, Power Query, and summaries instead of raw tables.
- Compress data files and remove unused formatting or named ranges.
Even as big data tools grow in popularity, Excel still serves as the final analytical layer — where bankers make sense of numbers before presenting results.
4. Dependence on Manual Processes
While Excel can automate many tasks, it still requires human judgment. Automation helps speed things up, but investment bankers must still verify assumptions, check logic, and interpret outcomes. No macro can replace the analyst’s understanding of valuation theory or market context.
For example, Excel might project growth at 10%, but only a skilled banker can assess whether that’s realistic based on market trends or company fundamentals.
That’s why top banks emphasize the mantra:
“Automate processes, not thinking.”
The key is to let Excel handle mechanical work — while humans handle the strategy.
Best Practices for Reducing Risk and Maintaining Model Hygiene
Maintaining a “clean” Excel model is as essential as financial accuracy itself.
Here’s how elite investment bankers keep their models organized, efficient, and audit-proof:
- Separate input, calculation, and output sheets: This structure makes it easier to debug and update.
- Avoid hardcoding numbers: Always use linked cells or assumptions.
- Document assumptions clearly: Include notes or comments explaining each key figure.
- Use consistent naming conventions: Helps new team members understand the model quickly.
- Run periodic checks: Use “Trace Precedents” and “Error Checking” to identify broken links.
By following these principles, analysts ensure that their Excel files are not just functional but institution grade ready to withstand scrutiny from auditors, clients, or regulators.
The Future of Excel in Investment Banking
Despite the rise of automation, AI, and advanced analytics tools, Excel continues to evolve becoming smarter, faster, and more collaborative than ever before.
1. Smarter Excel: AI-Powered Analysis
Modern Excel now includes features like data types, Power Query, and AI insights, allowing analysts to pull live financial data and generate forecasts automatically.
For instance, an analyst can now fetch market data directly from the web, analyze trends, and build valuation projections in minutes — tasks that once took hours.
AI tools embedded in Excel also assist in cleaning data, identifying outliers, and recommending charts — helping analysts focus on interpretation instead of formatting.
This means that future bankers won’t just use Excel for number crunching but for intelligent analysis and predictive insights.
2. Collaboration Across Global Teams
The shift to cloud-based Excel (Office 365) has revolutionized global collaboration.
Teams spread across time zones from Mumbai to London to New York can now work on the same workbook in real time.
No more email chains or duplicate files. Every edit is instantly visible, and version history ensures that nothing is lost.
For global investment banks, this feature has drastically improved productivity, especially during live deals where time is critical.
3. Automation and API Integration
Today, Excel can connect with external APIs and data systems, making it a live analytical engine.
For example, a global investment bank integrated Excel with Bloomberg API feeds to pull in live market data for LBO models automatically.
This automation reduced manual data entry by 90% and ensured that every valuation reflected the most current market movements.
Similarly, Excel dashboards linked to Power BI or SQL databases are now common in top investment banks, allowing for real-time insights during deal discussions.
4. Why Excel Will Continue to Dominate
Many modern tools like Python, R, or specialized valuation platforms are excellent, but none combine simplicity, accessibility, and flexibility like Excel.
Here’s why Excel still reigns supreme in investment banking:
- It’s universally used and understood.
- It allows creative model design.
- It integrates seamlessly with PowerPoint and Word (essential for pitchbooks).
- It’s auditable, traceable, and regulator friendly.
In short, Excel remains the language of finance — every banker, from intern to managing director, speaks it.
5. The Enduring Value of Excel Mastery
Excel mastery is more than a skill, it's a career foundation.
Every top investment banker started as an analyst building Excel models late into the night. Over time, they learned not just the formulas but the logic behind every assumption.
For aspiring professionals, mastering Excel builds three vital abilities:
- Analytical thinking: Understanding how inputs affect outputs.
- Attention to detail: Spotting small errors that make big differences.
- Financial storytelling: Presenting numbers in a way that drives decisions.
Learning Excel is not about memorizing shortcuts, it's about thinking like an investor.
As technology evolves, Excel will evolve with it. But the mindset and logic it teaches will remain timeless.
Conclusion: Excel — The Timeless Partner in Investment Banking
From automating valuations to visualizing billion-dollar transactions, Excel has proven itself as the backbone of investment banking.
Its true power lies not just in its calculations but in its ability to transform data into insight, and insight into action.
Even as AI, machine learning, and cloud tools reshape finance, Excel continues to adapt — more intelligent, faster, and more collaborative than ever before.
For every aspiring investment banker, one truth remains constant:
Master Excel, and you master the language of modern finance.
So, whether you’re preparing for an investment banking career in India, aiming to join the top investment banks, or exploring advanced Excel for investment bankers, remember — this tool isn’t just software. It’s your bridge between numbers and strategy.

Subscribe for next update
All Blogs